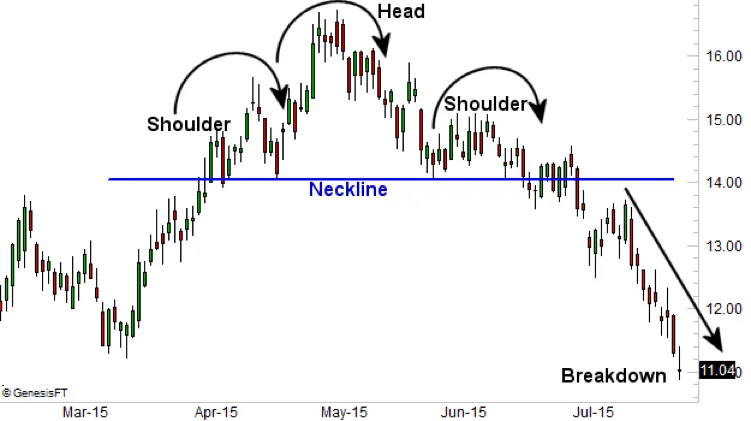
How to predict a price change on the foreign exchange or stock market? As a rule, traders strive to spot a certain pattern and make their conclusions on its basis. The point is that market participants tend to behave similarly in similar situations, which is why such patterns almost never fail.
Today, we would like to tell you about the pattern that allows forecasting a price drop with precision of over 90%. It is a universal solution for almost any market and trader:
· developing strategies for beginners;
· finding precise entry points for professionals;
· intraday trading ― lower and higher time frames;
· spotting short and long positions;
· predicting reversals.
This pattern consists of three peaks. They resemble (and are referred to as) two shoulders and a head, which is why it is called the head and shoulders pattern. Besides, there is a line beneath, which connects all the three peaks and is called a neckline.
How to find this pattern on the chart?
1. There should be a rising trend preceding it.
2. The second peak must be higher than the other two.
Then, one can safely say that it will be followed by a decrease in price. According to research, this drop reaches about 23% on average and is observed in around 93% of cases. Obviously, that is a clear signal to sell the asset monitored.
How does that work? The point is that the right (third) shoulder is lower than the head, which means the rising trend is losing its strength as the number of buyers on the market is decreasing. Meanwhile, due to sellers’ activeness, the price is expected to drop soon.
Now, when the meaning of the signal is clear, you probably want to know when to take profit. To determine the target price, subtract the distance from the second peak (or the head) to the line beneath (the neckline) down.
In addition, this pattern can be inverted. In this case, it is preceded by a series of price decreases and is followed by an increase in value.
Certainly, like any other instrument, this one requires profound practice. Here are a few tips on how to utilize it efficiently:
· Try your hand via a demo account first. Learn how to spot and apply the pattern with virtual money.
· Monitor trade volumes. Do not rely on the pattern solely.
· Watch the market and write down your observations and conclusions so that you can perform the gap analysis afterward.
· Apply stop-loss limits.
In sum, the effectiveness of this pattern is proven by both research and real traders’ experience. Yet, to obtain positive results, one must devote enough time to studying and training.

