The S&P 500 futures (ES) is a much more liquid market than oil (CL), Gold (GC), Euro (6E) futures, which are also incredibly popular among traders. However, the average daily trading volume for ES futures is 1.5 million contracts – which is an impressive number. It also has a high throughput for a wide variety of trading strategies and deposit sizes. Therefore, it is worth taking a closer look at trading these derivatives.
The S&P 500 stock index is a basket of 505 shares of 500 large-cap public companies that are traded on the American stock exchanges NYSE, Nasdaq. Large-cap companies are companies with a market value of shares in excess of 10 billion dollars. Among the 500 companies included in the index, 5 companies have issued two types of shares. For this reason, the number of shares in the index is 505. ES is a derivative asset for the index and allows you to conduct speculative transactions or hedge positions.
And even taking into account the news factor, which always strongly influences futures, many traders prefer to trade with it. The news background is tracked thanks to the economic calendar, and the actual analysis, respectively, is carried out on the chart.
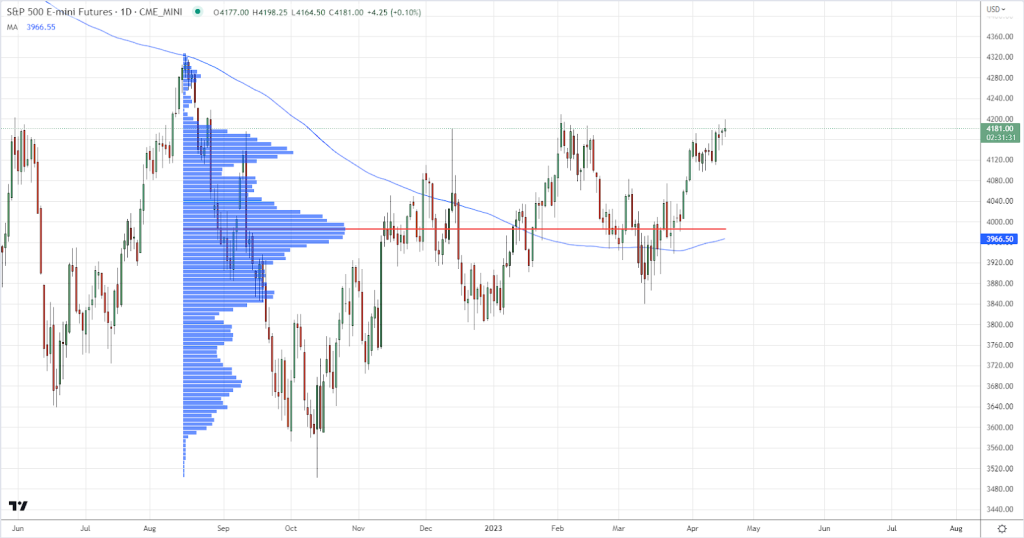
Considering that American companies have been growing steadily lately, ES reflects this growth and seeks to refresh the January high of 4200. In fact, it is in a resistance zone that has been holding for almost a whole year.

As can be seen above, in August 2022 there was a false breakout and on November 13, 2022 the price dropped to that of November 2020. From the moment of this fall, a cyclical growth began.
It is important to remember that the index itself reflects the health of the United States economy. Therefore, it is highly liquid. Due to the huge trading volumes and good volatility, you can earn on these futures within one day. But be always aware of the risks. And unlike stocks, ES contracts are traded at any time of the day or night, from mid-Sunday to mid-Friday.
So, with a high probability, the price will break through the aforementioned resistance. If this happens in the near future, then a rollback to the support level would be a good opportunity to enter a buy trade.

In another case, we will not see a quick breakout, and then buyers will have no choice but to let the price fall to the 4000 area. There you can find the POC of the range of the current horizontal movement in the Volume Profile. As well as the 200-day MA, which is a current support.

Also, you can apply the 50-day MA to determine the nearest support for intraday trading. It is located in the area of 4050 and coincides with the mirror level 4050-4080, which previously acted as resistance. This combination may even be more successful than MA200 and POC.

To reduce risks, it is better still to note the possibility of a rollback to support, rather than a quick upward breakout. Buying or selling at the current price can be quite risky, as any news can have a detrimental effect on the deposit size. And so it is always possible to set pending orders and cancel them if necessary.
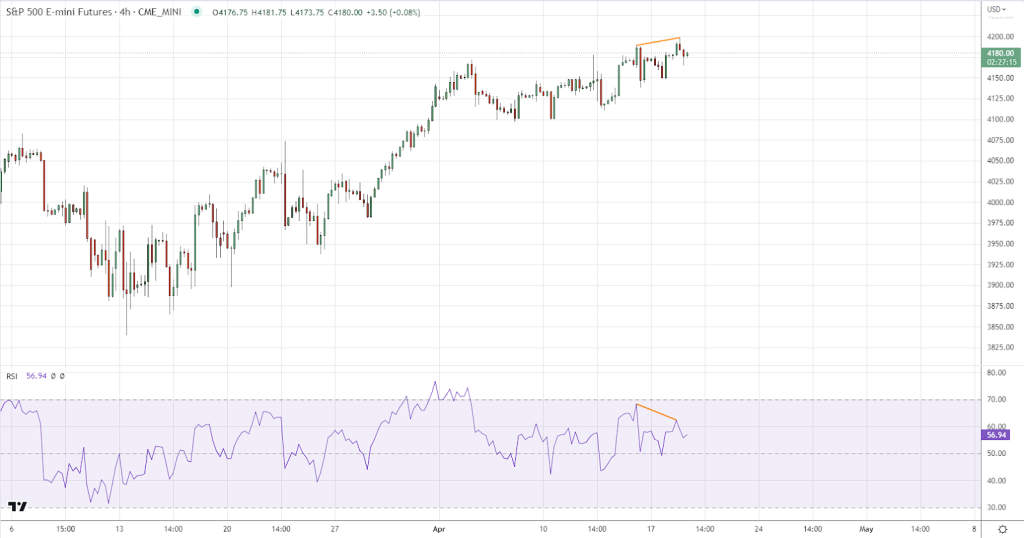
In addition, on the 4-hour chart, the RSI indicator shows a bearish divergence. And although the line is not above 70, the sell signal can be confirmed and the price will fall.

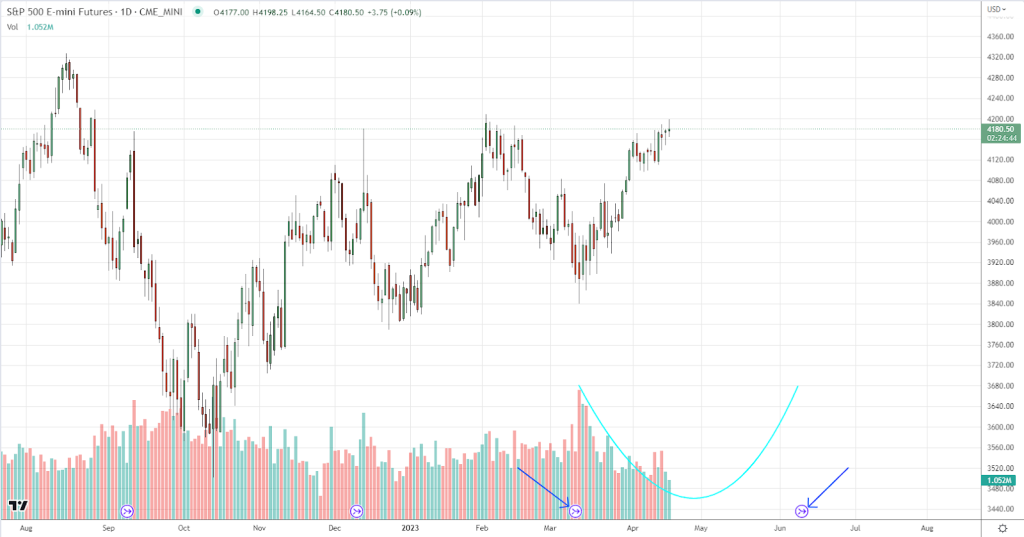
It is also worth considering the factor of volumes, which have been steadily declining since March 13. We are now in the middle of the current futures contract cycle, and such a decrease may indicate that resistance testing is taking place without the participation of major market players. It can be concluded that the vast majority of investors have begun the active phase of rebalancing their investment portfolios.
In the second half of the cycle, we can assume an increase in volumes and the number of transactions that will reach a peak by the time of expiration. It is important to remember that volumes always increase towards the end of the contract, as many traders liquidate their positions, which can become an impulse and give room for maneuver to accelerate the market.

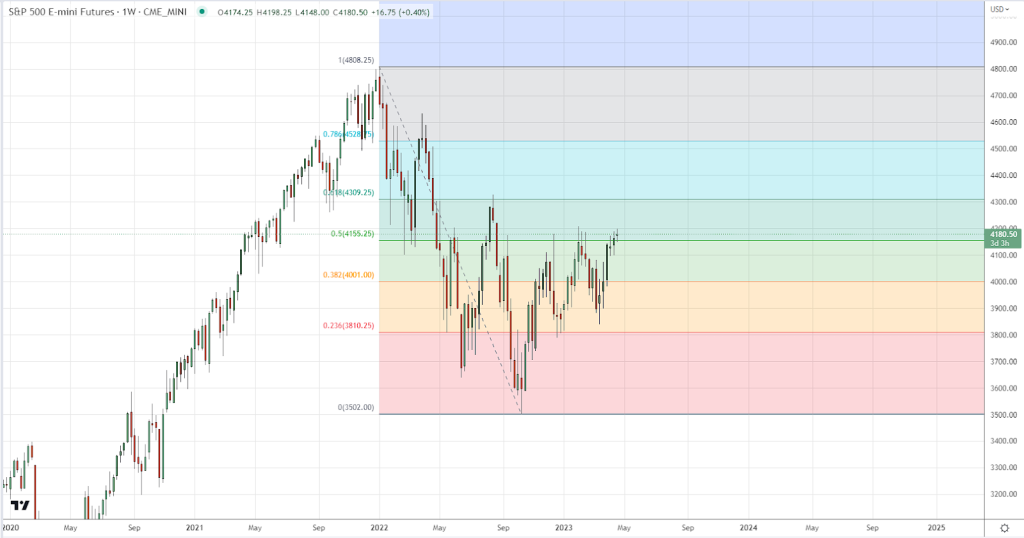
Globally, it can be said that the price is in a protracted correction and tends to get out of it. By using the Fib Retracement tool, you can easily confirm all previously determined levels.
The current resistance coincides with the 0.5 level, which has probably already been tested, but it is worth allowing a potential false breakout. As well as support at 0.382, which, although it has been repeatedly tested, remains relevant to this day. The next target for buyers in the 4300 area, where the high remained after the increase in August 2022, coincides with 0.618.

In conclusion, it is worth turning back to the news background and following the events on the economic calendar even more carefully. Investors are gearing up for a tough week of corporate results and comments from Federal Reserve officials that could provide more information on interest rate changes.
More reports are expected this week from major US banks, including Goldman Sachs, Bank of America Corp and Morgan Stanley. Other companies due to report this week include Johnson & Johnson, Tesla, and Netflix.
In addition, US Treasury yields rose on Monday, and the Fed is expected to speak later in the week. Investors, judging by the decrease in volumes, seem to be in waiting mode.
Markets will continue to monitor corporate profits, economic data, and comments from Federal Reserve officials.
With thorough analysis, you can always be ready for any outcome of events. The combination of technical and fundamental factors suggests that a quick breakout, although likely, is still less probable than another long sideways movement and a fall towards supports. At the end of the day, only the news will be the final factor for planning transactions. In any case, it is worth monitoring the situation carefully because the next battle is almost upon us.

