Have you also felt overwhelmed by the sheer volume of data your business generates?
In a world where data is king, making sense of this digital deluge can seem like an unbeatable challenge.
The right interpretation of data can be the difference between a groundbreaking decision and a missed opportunity.
But how do you transform this complex, often intimidating, information into something actionable?
This is where the art and science of data visualization come into play.
Decoding Data Overload
Studies indicate significant time lost in data interpretation and average losses of $15 million annually due to data misinterpretation.
The human brain is wired to process visuals much faster than text or numbers. That’s where data visualization steps in – turning complex data sets into clear, concise, and engaging visual representations.
Without clear visual aids, stakeholders become overwhelmed, leading to disengagement and suboptimal use of real-time data, impacting responsiveness and overall business performance.
What is Data Visualization?
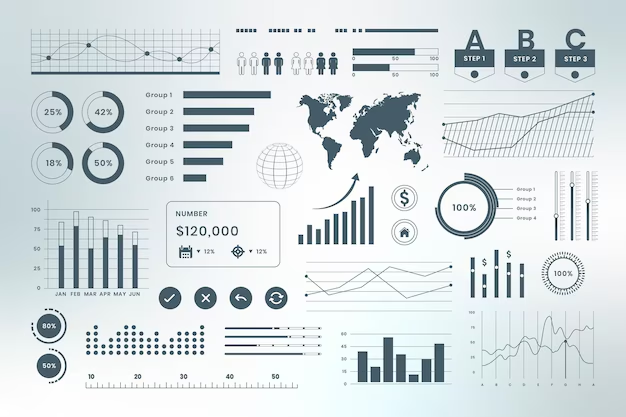
At its core, data visualization is about storytelling. It’s a way to bring your data to life using visuals like graphs, charts, and maps.
These aren’t just pretty pictures; they’re tools that help us see trends, outliers, and patterns that might be invisible in raw data.
Transforming Industries with Data Visualization: A Multifaceted Approach
In today’s data-driven landscape, data visualization serves as a transformative tool across various sectors. Let’s delve into some of the key industries:
- Healthcare
Data visualization plays a crucial role in enhancing patient care and healthcare operations.
It enables medical professionals to efficiently track patient health records, visualize disease patterns, and allocate resources effectively. This leads to better patient care and more informed decision-making in treatment and public health management.
- Logistics
In logistics, data visualization is instrumental in optimizing supply chains, facilitating real-time cargo tracking, and route planning.
This not only boosts efficiency but also enhances risk management and inventory control, resulting in streamlined operations and improved customer service.
- Insurance
The insurance industry leverages data visualization for precise risk assessment, fraud detection, and customer segmentation.
By visualizing claims and policy data, insurers can set competitive prices and improve their operational efficiency, ensuring a more tailored and efficient service for their clients.
- eCommerce
E-commerce businesses utilize data visualization to analyze customer behavior, sales performance, and inventory management.
This aids in understanding market trends, optimizing marketing strategies, and enhancing the overall user experience, which is crucial for customer retention and business growth.
- Education
In the education sector, data visualization assists in tracking student performance, resource allocation, and curriculum development.
Schools and colleges can analyze enrollment trends and academic data to make strategic decisions, thereby enhancing the quality of education and student outcomes.
Squillion Tech’s Approach to Visualization
At Squillion Tech, we turn complex data into clear, engaging visual stories. Our team crafts interactive visuals that simplify decision-making.
Delighted over 200+ clients, we tailor each visualization to your business needs, ensuring it’s not just appealing but full of actionable insights. Our aim is to make data accessible and insightful for your entire team.
Crafting the Visualization Journey
Embarking on the data visualization journey with Squillion Tech is like setting sail on a sea of information with the best navigational tools at your disposal.
- We start by diving deep into your data ocean, gathering every relevant piece of information.
- Next, we meticulously clean and organize this data, ensuring that what surfaces is nothing but pure, actionable insights.
- Our experts then select the perfect chart types and visualization methods to represent your unique data story soundest.
- Finally, we bring your data to life, creating dynamic, interactive visualizations that not only reveal hidden patterns and trends but also turn them into clear, compelling narratives.
Ready To Make Your Data Speak?
In today’s fast-paced business world, data visualization is not just a tool; it’s a necessity. It’s about bringing life to data, turning numbers into narratives, and insights into actions.
Embrace the visual power of data, and let it be the compass that guides your business to new heights. Connect with Squillion today!
Author bio
Karan Mehta
Karan Mehta is the co-founder and CEO of Squillion Technology. With a background in Business Administration, he brings a unique perspective to the world of technology and business. Karan is a dedicated and driven individual who plays a pivotal role in overseeing the company’s strategic direction and operations. Karan is passionate about fostering business growth and nurturing client relationships. He is committed to staying at the forefront of the ever-evolving technology landscape, ensuring that his company remains at the cutting edge of innovation in this competitive market.

