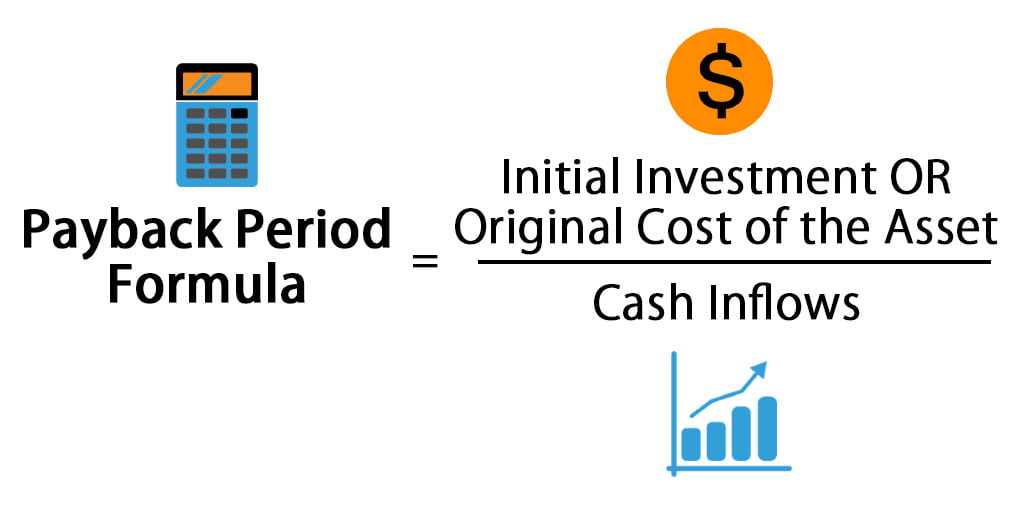
The payback period is the amount of time (usually measured in years) it takes to recover an initial investment outlay, as measured in after-tax cash flows.
It is an important calculation used in capital budgeting to help evaluate capital investments.
For example, if a payback period is stated as 2.5 years, it means it will take 2½ years to receive your entire initial investment back.
Advantages and Disadvantages of the Payback Period
One primary advantage of evaluating a project or an asset by its payback period is that it is simple and straightforward. Basically, you’re asking: “How many years until this investment breaks even?” It is also easy to apply across several projects. When analyzing which project to undertake or invest in, you could consider the project with the shortest payback period.
But there are a few important disadvantages that disqualify the payback period from being a primary factor in making investment decisions.
First, it ignores the time value of money, which is a critical component of capital budgeting.
For example, three projects can have the same payback period; however, they could have varying flows of cash.
Without considering the time value of money, it is difficult or impossible to determine which project is worth considering. Also, the payback period does not assess the riskiness of the project. Projecting a break-even time in years means little if the after-tax cash flow estimates don’t materialize.
How to Calculate the Payback Period in Excel
Financial modeling best practices require calculations to be transparent and easily auditable. The trouble with piling all of the calculations into a formula is that you can’t easily see what numbers go where or what numbers are user inputs or hard-coded.
The easiest method to audit and understand is to have all the data in one table and then break out the calculations line by line.
Calculating the payback period by hand is somewhat complex. Here is a brief outline of the steps, with the exact formulas in the table below (note: if it’s hard to read, right-click and view it in a new tab to see full resolution):
- Enter the initial investment in the Time Zero column/Initial Outlay row.
- Enter after-tax cash flows (CF) for each year in the Year column/After-Tax Cash Flow row.
- Calculate cumulative cash flows (CCC) for each year and enter the result in the Year X column/Cumulative Cash Flows row.
- Add a Fraction Row, which finds the percentage of remaining negative CCC as a proportion of the first positive CCC.
- Count the number of full years the CCC was negative.
- Count the fraction year the CCC was negative.
- Add the last two steps to get the exact amount of time in years it will take to break even.